> ## Documentation Index
> Fetch the complete documentation index at: https://docs.presenton.ai/llms.txt
> Use this file to discover all available pages before exploring further.

# Tables and charts

> Add and edit structured data on a slide.

## Add structured content

Open the appropriate editor rail, add one item at a time, and keep it selected while configuring its content and placement.

<video className="doc-video" controls preload="metadata" playsInline src="https://mintcdn.com/presenton-521d9e2f/isevrd3o6JPIkznF/images/user-guide/editing-and-refining/guided/charts-tables-workflow.mp4?fit=max&auto=format&n=isevrd3o6JPIkznF&q=85&s=da99dc6592aae1383fba524ecf81c07f" data-path="images/user-guide/editing-and-refining/guided/charts-tables-workflow.mp4">
  Your browser does not support the video tag.
</video>

<Tabs>
  <Tab title="Tables">
    Open **Tables** and select **Simple Table**.

    <div className="guide-media guide-media--panel">
      <p className="guide-media-label">Simple Table available from the editor rail</p>

      <div className="guide-media-viewport">
        <img src="https://mintcdn.com/presenton-521d9e2f/isevrd3o6JPIkznF/images/user-guide/editing-and-refining/canvas/table-library-panel.png?fit=max&auto=format&n=isevrd3o6JPIkznF&q=85&s=d64fcbf317f04dcb74faa91e0879c944" alt="Tables panel with the Simple Table option" width="405" height="180" data-path="images/user-guide/editing-and-refining/canvas/table-library-panel.png" />
      </div>
    </div>

    <div className="guide-media guide-media--workflow">
      <p className="guide-media-label">Edit table cells directly on the slide</p>

      <div className="guide-media-viewport">
        <video className="doc-video" controls preload="metadata" src="https://mintcdn.com/presenton-521d9e2f/isevrd3o6JPIkznF/images/user-guide/editing-and-refining/canvas/table-editing.mp4?fit=max&auto=format&n=isevrd3o6JPIkznF&q=85&s=da7a95d52985cc1cdf7c8294a61f3e17" data-path="images/user-guide/editing-and-refining/canvas/table-editing.mp4">
          Your browser does not support the video tag.
        </video>
      </div>
    </div>

    Select the table, edit the required cells, and verify every label and value against the source.
  </Tab>

  <Tab title="Charts">
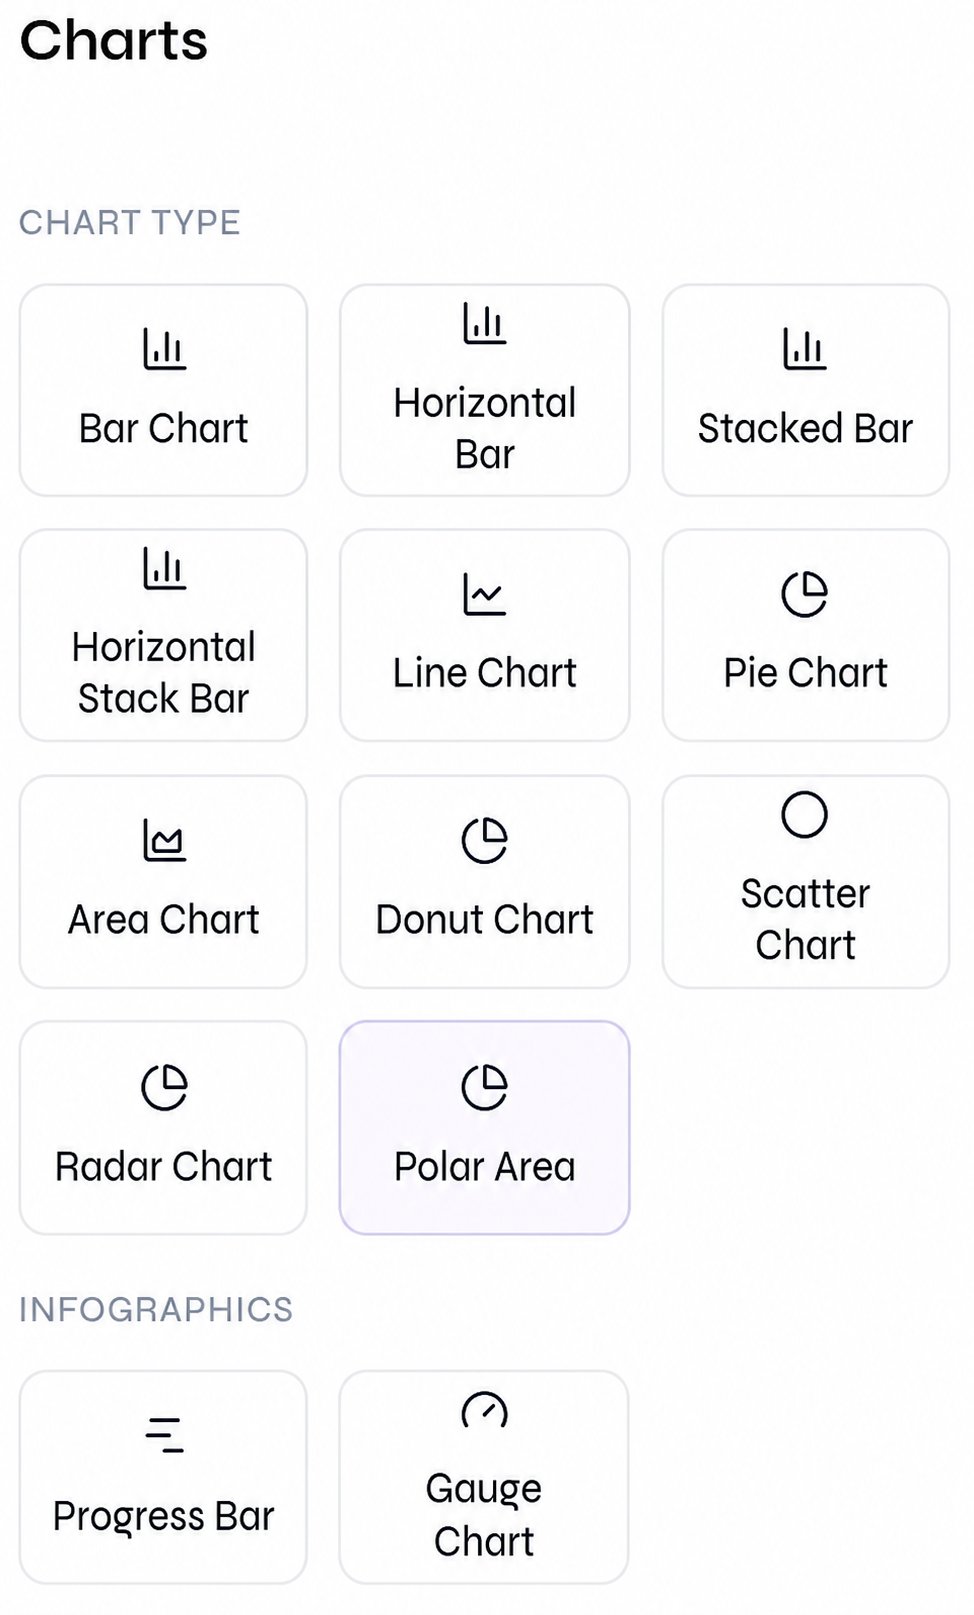
    Open **Charts** and choose the form that matches the data.

    <div className="guide-media guide-media--panel">
      <p className="guide-media-label">Chart and infographic types available from the editor rail</p>

      <div className="guide-media-viewport">
        <img src="https://mintcdn.com/presenton-521d9e2f/rOUTEAd7cZsBnrS8/images/user-guide/editing-and-refining/canvas/chart-library-panel.png?fit=max&auto=format&n=rOUTEAd7cZsBnrS8&q=85&s=8a58c1bb266331bf7d0ceadac2b62530" alt="Charts panel with bar, line, pie, area, donut, scatter, radar, polar area, progress bar, and gauge options" width="974" height="1615" data-path="images/user-guide/editing-and-refining/canvas/chart-library-panel.png" />
      </div>
    </div>

    <div className="guide-media guide-media--workflow">
      <p className="guide-media-label">Add a chart and edit its data and presentation</p>

      <div className="guide-media-viewport">
        <video className="doc-video" controls preload="metadata" src="https://mintcdn.com/presenton-521d9e2f/isevrd3o6JPIkznF/images/user-guide/editing-and-refining/canvas/chart-editing.mp4?fit=max&auto=format&n=isevrd3o6JPIkznF&q=85&s=8510858810a9b746cbd893074f6b1641" data-path="images/user-guide/editing-and-refining/canvas/chart-editing.mp4">
          Your browser does not support the video tag.
        </video>
      </div>
    </div>

    Use a bar chart for category comparison, a line or area chart for change over time, and a table when exact values matter more than the pattern.
  </Tab>
</Tabs>

<Warning>
  Visual editing does not validate data. Recheck units, periods, categories, totals, and plotted values before export.
</Warning>