

Prepare the data
Use structured data in the browser
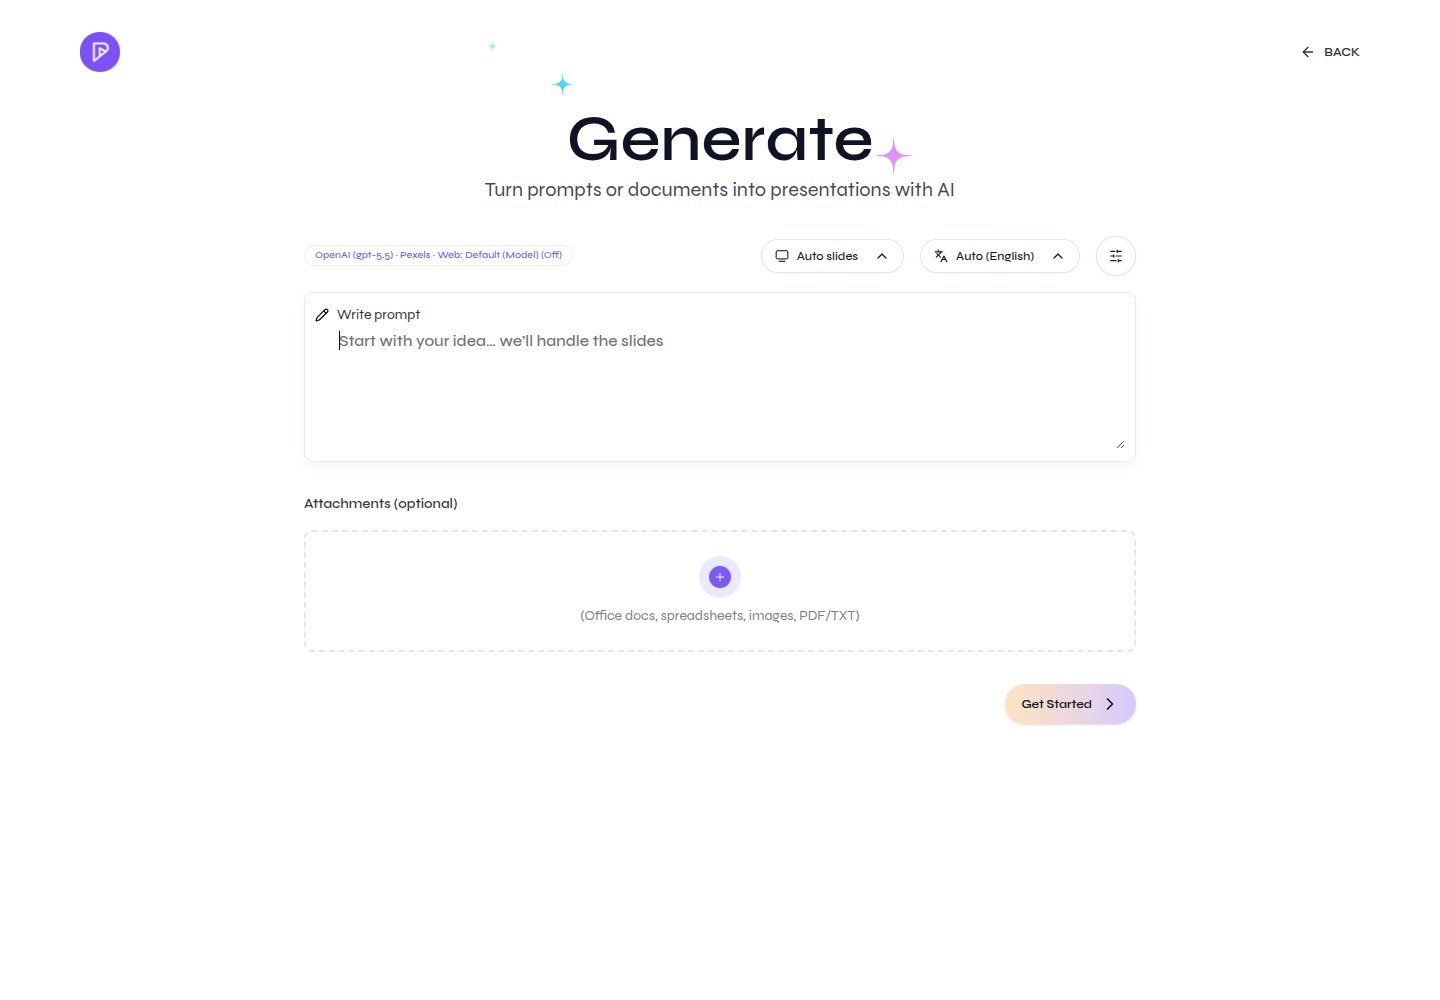
Cloud and open-source Presenton accept structured source files through the attachment area, but the visible file list differs. Cloud’s live Generate screen advertises.csv, .xlsx, and .xls; the current open-source upload component also supports spreadsheet and delimited-data extensions including .xlsm, .ods, and .tsv. Attach the file and describe the analysis or comparison in the prompt. In the open-source browser flow, select an explicit language when attachments are present; follow the language control shown by Cloud.
- Cloud
- Open-source
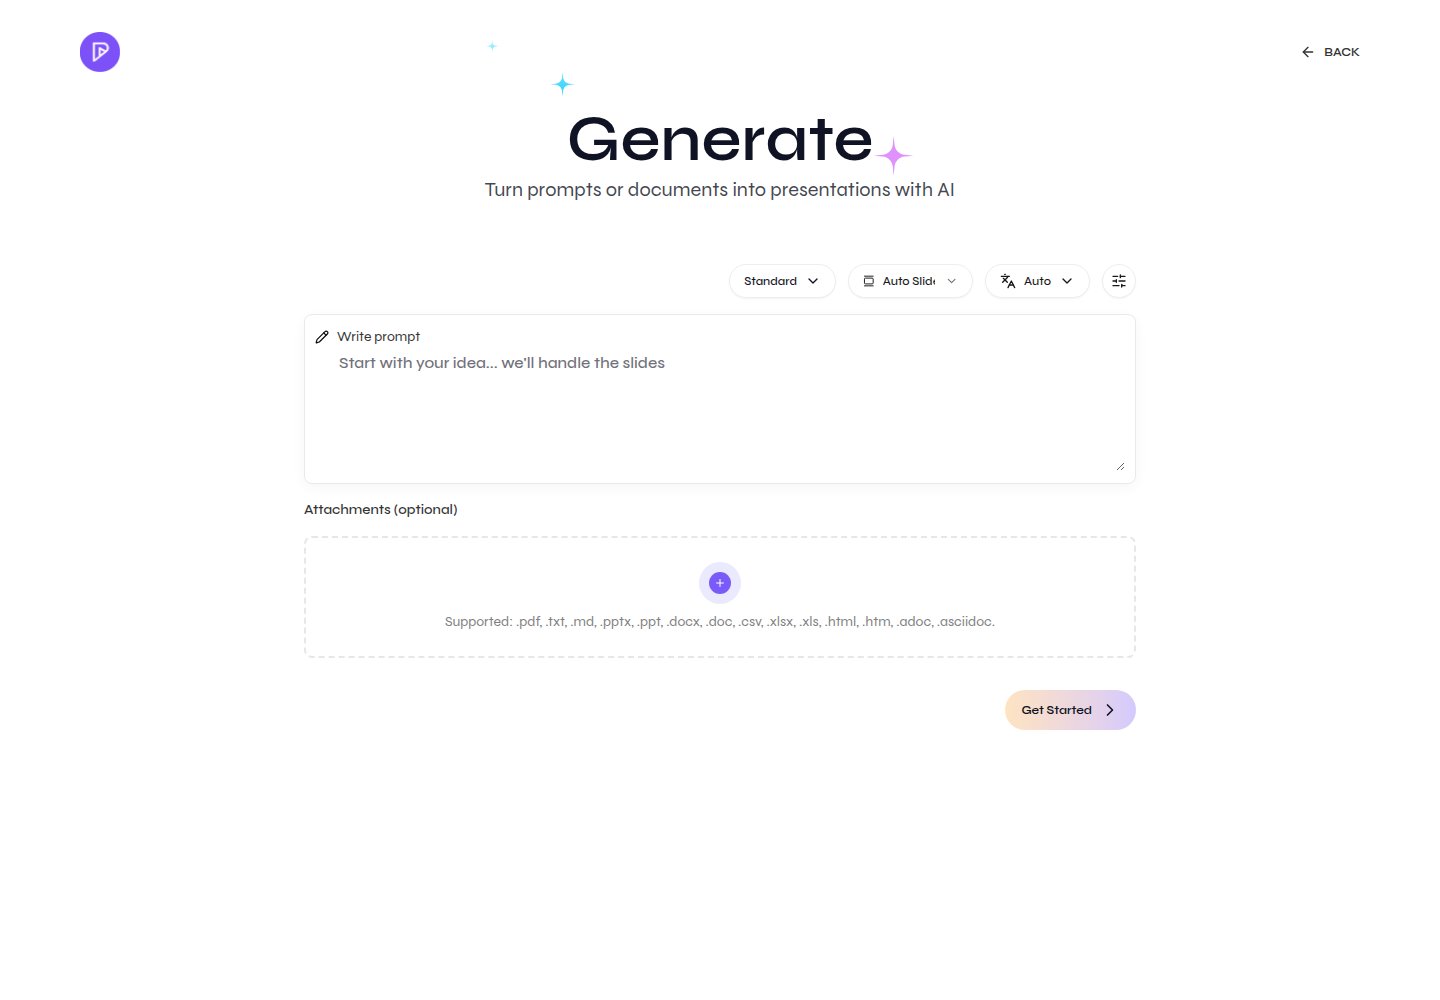
Attach a spreadsheet or CSV and check supported formats
Use structured data through an API
The API contracts are product-specific. Cloud documentation includes JSON generation against selected Standard template layout schemas. Open-source deployments should use the self-hosted presentation endpoints and the live OpenAPI schema for the installed release. Do not copy a Cloudfrom-json request into the self-hosted v1 API without adapting it to that contract.
Cloud structured generation
Supply layout-specific JSON content for a Standard template.
Self-hosted API
Use the API documentation for the endpoints exposed by your deployment.
Review generated analysis
- Recalculate totals, percentages, and deltas independently.
- Confirm chart axes, category order, and labels.
- Check whether the presentation compares like-for-like periods and units.
- Use tables when exact values matter and charts when patterns matter.
- Remove fields that expose sensitive or unnecessary data.