

1280 × 720 canvas, so you can refine the AI result without rebuilding the deck elsewhere.
What the editor supports
Direct manipulation
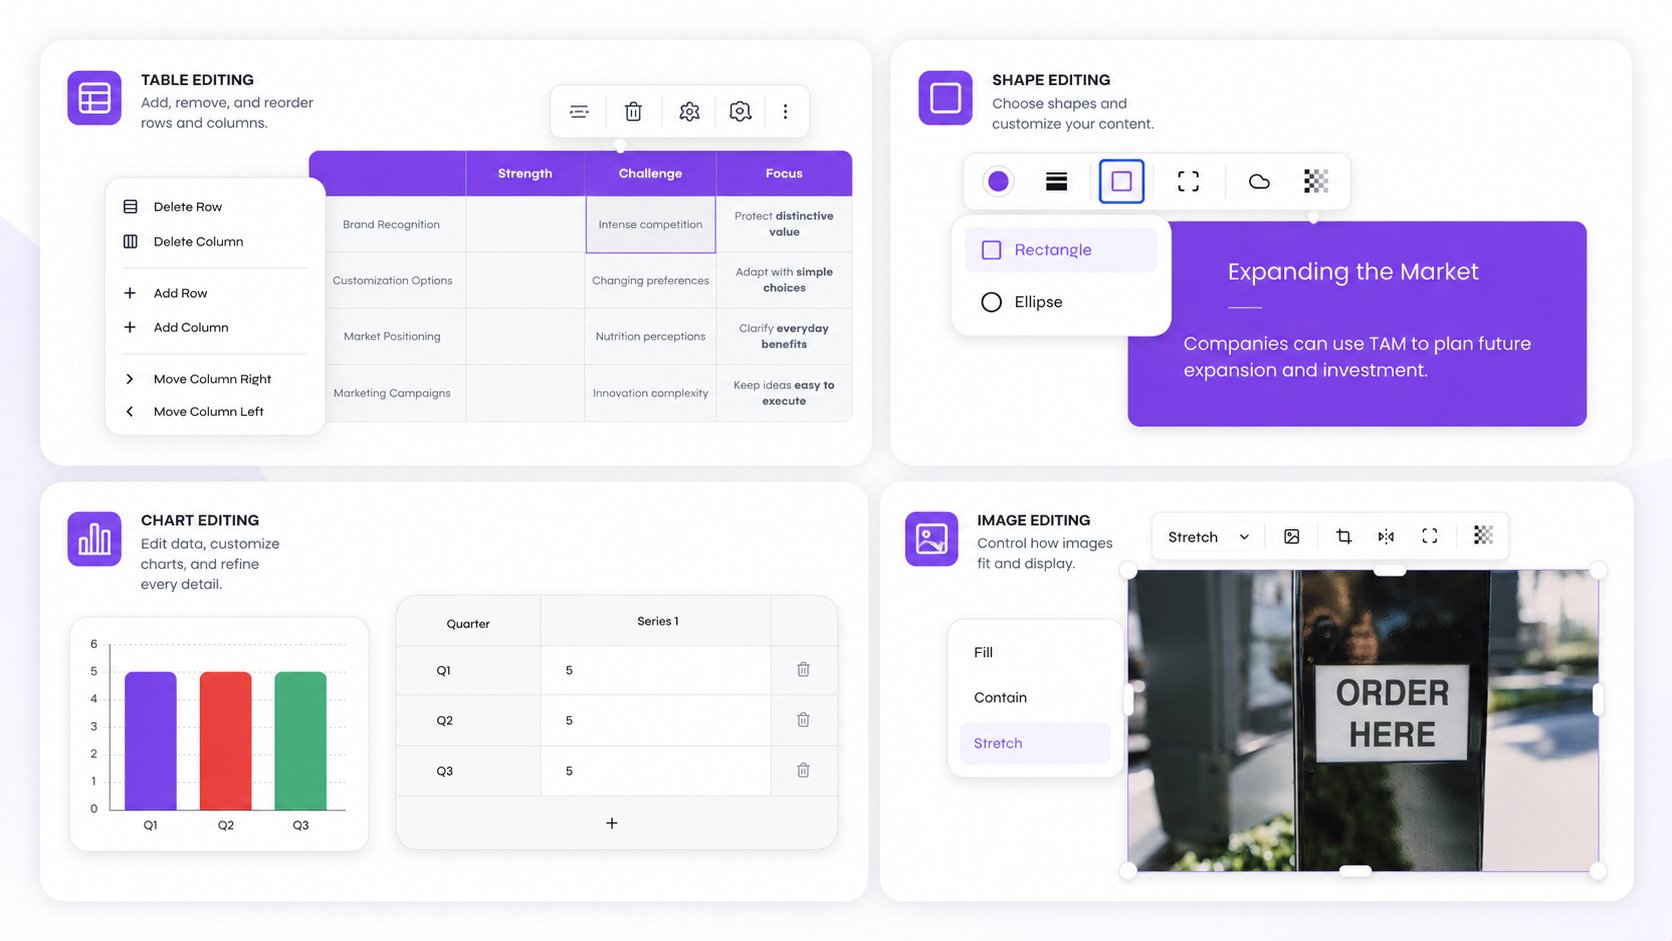
Select, move, resize, rotate, duplicate, delete, copy, paste, and reorder slide objects.
Rich text
Edit mixed formatting, fonts, size, color, alignment, spacing, wrapping, and lists directly on the slide.
Images and icons
Replace images, change fit, crop focus, zoom, flip, opacity, rounded corners, and supported SVG icon colors.
Charts and tables
Edit chart data and styling or update individual table cells without recreating the slide.
Shapes and lines
Refine rectangles, ellipses, lines, fills, borders, opacity, radius, dash styles, and shadows.
Responsive layouts
Work with containers, flex layouts, grids, grouped elements, padding, gaps, alignment, and child items.
Enter edit mode
1
Open a presentation
Generate a deck or open an existing presentation from the dashboard.
2
Turn on Select Edit
Enable Select Edit in the presentation toolbar. The slide becomes an interactive canvas instead of a read-only preview.
3
Select the smallest useful object
Click a top-level component to move or resize it. Select a nested element when you want its type-specific toolbar.
4
Double-click for inline editing
Double-click text, tables, charts, icons, or images to open the corresponding editing flow when supported.
Select and arrange objects
Single and multiple selection
Click one object for a single selection. Use the normal modifier key for your operating system to add or remove top-level components from a multi-selection, then move the selected components together.Move, resize, and rotate
Drag a selected component to reposition it. Use the transform handles to resize or rotate supported objects. The editor commits the final geometry to the slide rather than storing a visual-only overlay.Layers and groups
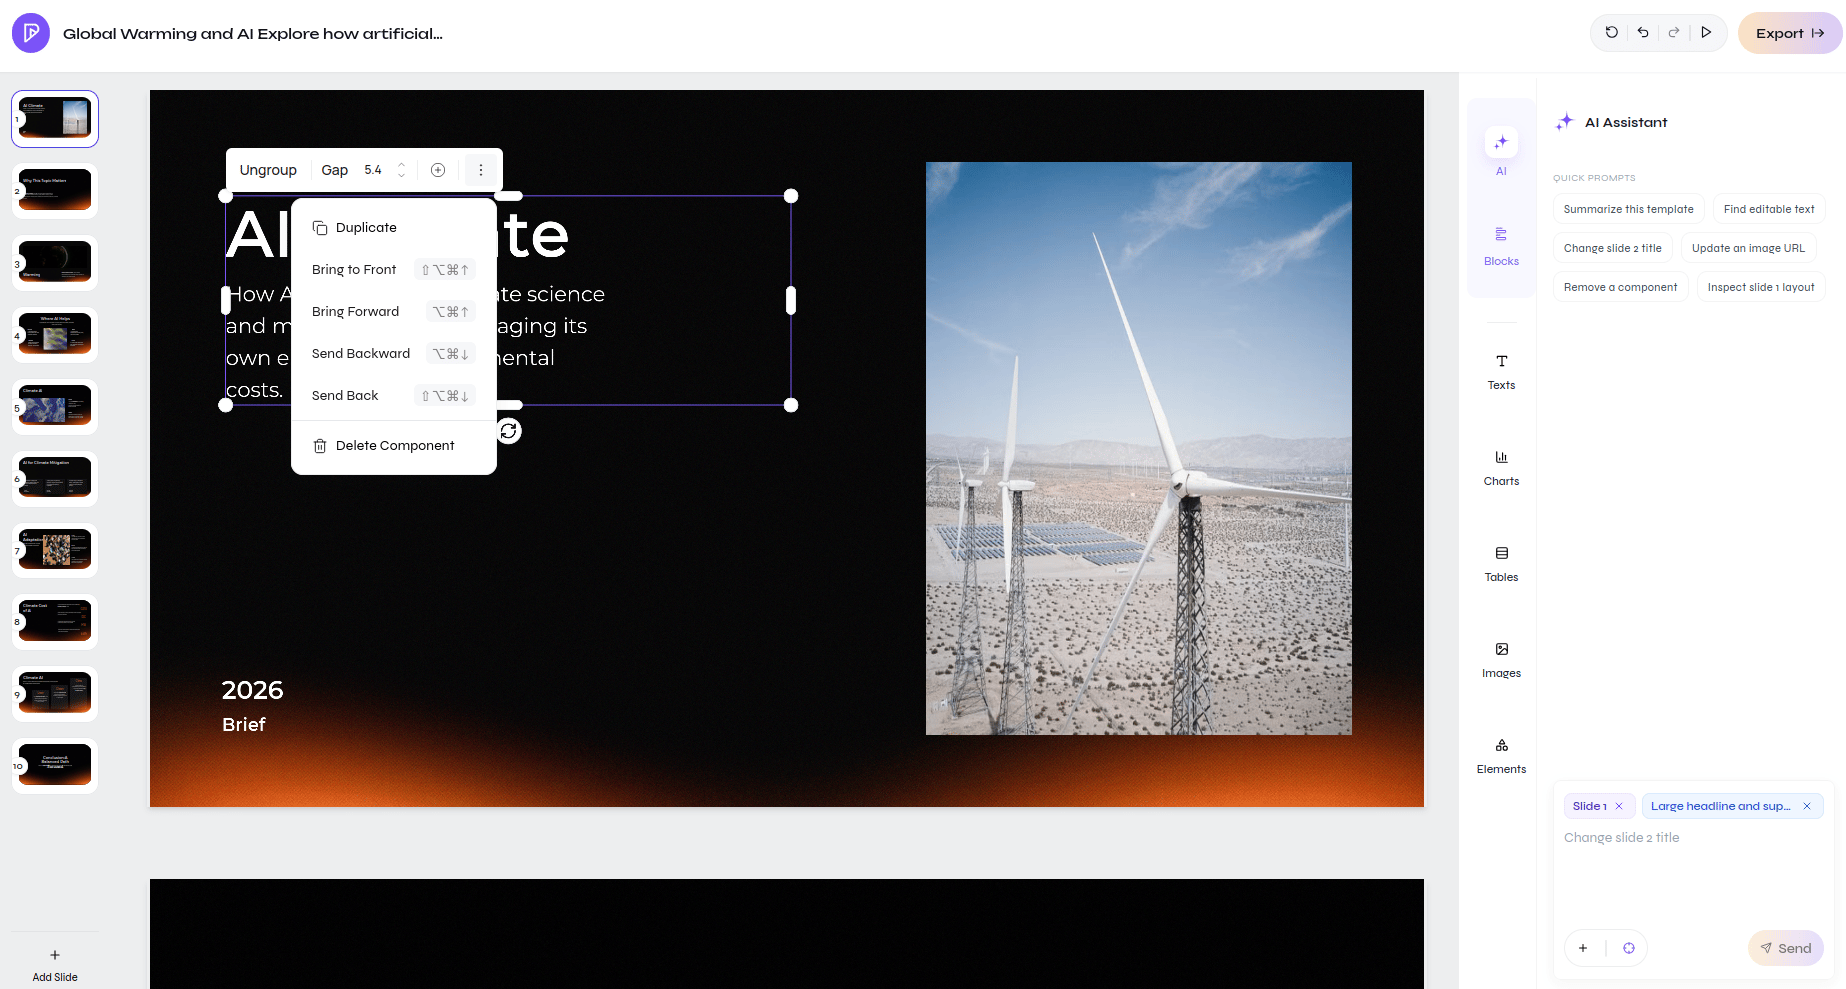
Use the selection actions to:- Bring an object forward or to the front.
- Send an object backward or to the back.
- Ungroup supported components into independently editable items.
- Duplicate a selection without using the system clipboard.
- Copy a selection and paste it with a safe offset and new identifiers.
Ctrl or Command together with Alt and the arrow keys:
Edit text and lists
Double-click text to edit it directly over the canvas. The rich-text editor supports:- Font family and size.
- Bold, italic, underline, and mixed styles within one text box.
- Text color and opacity.
- Horizontal and vertical alignment.
- Letter spacing and line height.
- Bulleted and numbered list markers for list elements.

Replace and crop images
Select an image to choose its fit mode:
The crop editor keeps the frame fixed while you move and scale the image behind it. You can also flip horizontally or vertically, change opacity, and adjust rounded corners. Replacing an image uploads the new asset and updates the selected element while keeping its place in the layout.
Icons are image-like SVG elements. For supported icons, open the icon editor to search for a replacement and update the icon color.
Edit chart data and presentation
The chart editor supports common bar, horizontal bar, stacked bar, line, area, pie, donut, polar, radar, scatter, and bubble configurations. Depending on the chart type, you can edit:- Categories, series names, and numeric values.
- Chart type and multiple series.
- Title and title color.
- Series or category colors.
- Data labels and legend visibility.
- Axis visibility, titles, grid lines, and colors.
Edit tables cell by cell
Double-click a table cell to edit its content inline. Table controls support cell selection and table-specific formatting while preserving the element’s position and size on the slide. Use tables for exact values and charts for patterns. If an AI-generated table contains important metrics, compare every value with the source document before publishing.Work with containers, flex, and grid layouts
Some template elements manage their children automatically:- Container controls fill, border, radius, shadow, padding, and alignment.
- Flex arranges children by direction, gap, growth, shrink behavior, and alignment.
- Grid places children into cells with spans and alignment.
- Group keeps related objects together until you ungroup them.
Use AI on a selected element
Select Edit also works with prompt-based editing. Select the target text, image, or supported component, open its AI edit action, describe one focused change, and apply the result. Good requests identify both the target and the change:Undo, redo, and deletion
Click the slide surface first so it is the active canvas, then use:
Undo and redo apply to the active slide editor history. If a shortcut appears to affect nothing, click the intended slide surface and try again.
Preview and export safely
The canvas editor and exported slide use the same structured Template V2 data, but fonts, browser rendering, and the target presentation application can still introduce small differences. Before sharing:- Exit Select Edit and review the slide at normal size.
- Check text wrapping, image crops, table overflow, chart labels, and layer order.
- Preview the complete presentation.
- Export a test PPTX when recipients will continue editing in PowerPoint.
- Export a PDF when fixed visual delivery matters more than editability.
AI assistant
Make presentation-wide or slide-wide changes through conversation.
Images, charts, and media
Choose the right visual type and configure image providers.